It has certainly been another interesting year for the shipping industry. With increased volatility, including the disruption to iron-ore exports, the impact of the devastating war in Ukraine, sanctions, and greater demand for coal, staying on top of market changes has never been more important. Keep reading below to catch up on just some of what happened across the industry in 2022.
Coal’s disrupted start to 2022
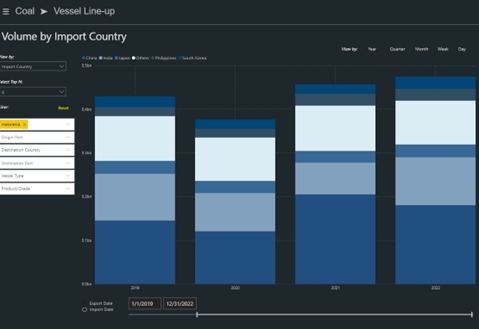
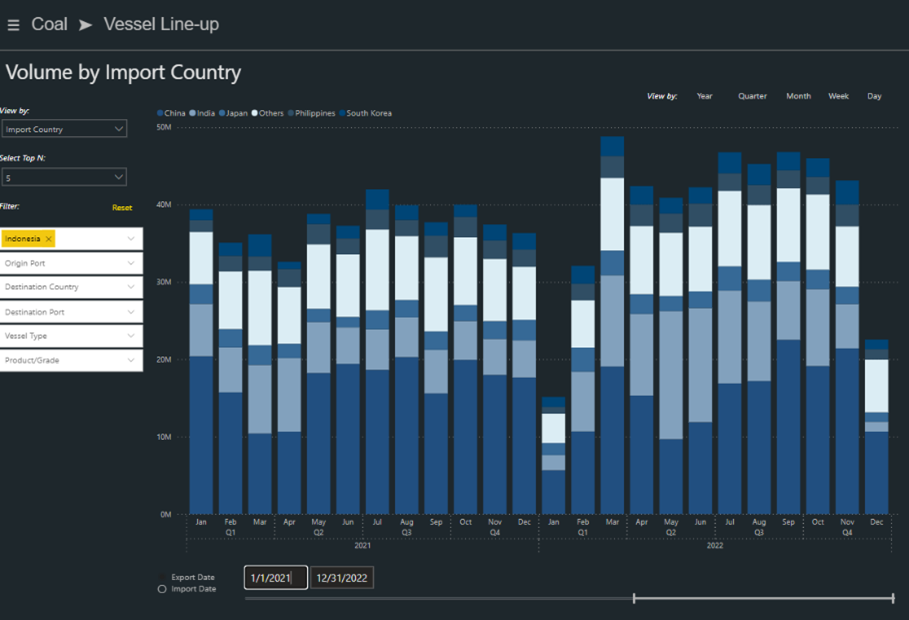
2022 started with a bang! On the 1st of January 2022, the Indonesian government imposed a month-long ban on coal exports to ensure sufficient domestic supplies were met for its state-owned utility – PLN (PT Perusahaan Listrik Negara). As a result, Indonesian coal exports in January were down 42% y-o-y. Eventually, on the 20th of January 2022, the ban was eased for about 139 companies as they met their local market sales requirements for PLN, thus averting a supply crunch and power outage in the southeast Asian archipelago.
Despite hiccups in the early stage, Indonesian coal exports have been strong and are 5% higher YTD y-o-y. Higher demand from India (almost 50% higher), Japan (8% higher), and sporadic shipments to Europe due to sanctions on Russian coal have been the major contributing factors.
Disruption of Brazilian iron-ore exports
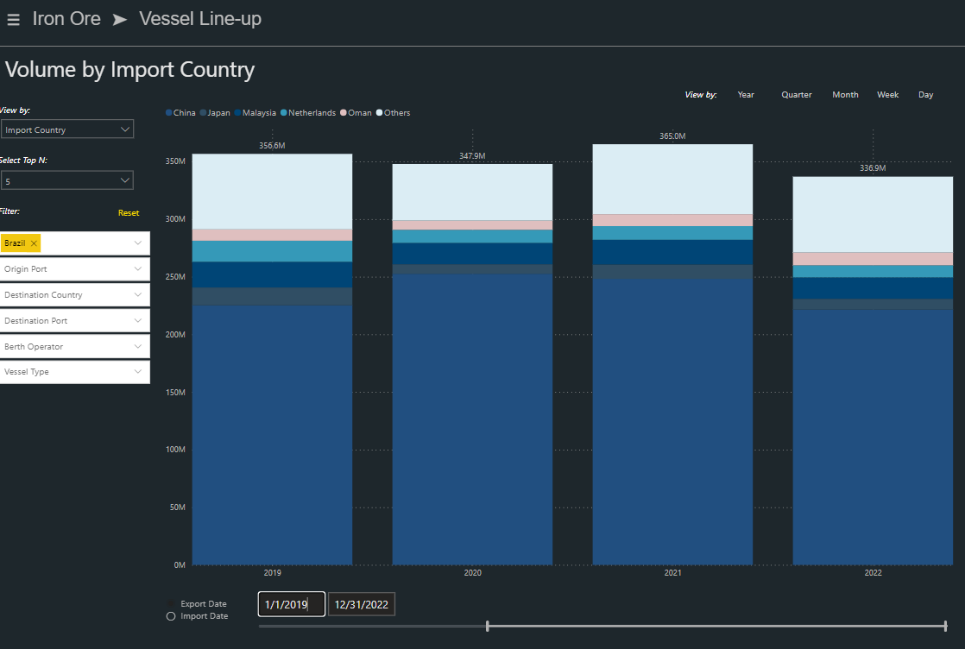
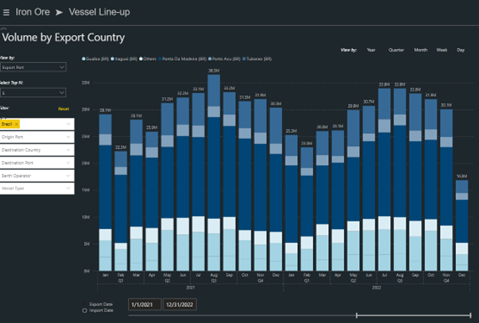
Heavy rainfall in the Minas Gerais province of southeastern Brazil disrupted iron operations at large mining companies at the start of this year. As a result, Brazilian Iron-ore export figures in January 2022 were down 18% from 29.21 Mt to 24.8 Mt. This incident was one of the main factors behind the strength in iron ore prices and the weakness in C3 freight rates at the start of 2022.
As the year progressed, iron ore loadings exhibited a strong recovery and hit their highest point of 2022 in July at 34Mt/month – 3% higher y-o-y. However, due to lackluster demand from China, -12% lower y-o-y, Brazilian exports lost steam and are expected to finish 9% lower in 2022 compared to 2021.
Russian Invasion of Ukraine
The main factor for the markets this year has undoubtedly been the Ukraine-Russia War. This event has had a catastrophic impact on vessels in the Black Sea with an almost 90% decrease in vessel supply to Ukraine in less than a month. With the ongoing hostilities the market has not yet recovered in the region and some vessels are still trapped in disputed ports.
This restriction of cargo through the Black Sea has had huge implications on agricultural commodity flows, pushing up prices and causing food security issues. This was only able to start moving again in August when the Black Sea Grain Initiative was reached.
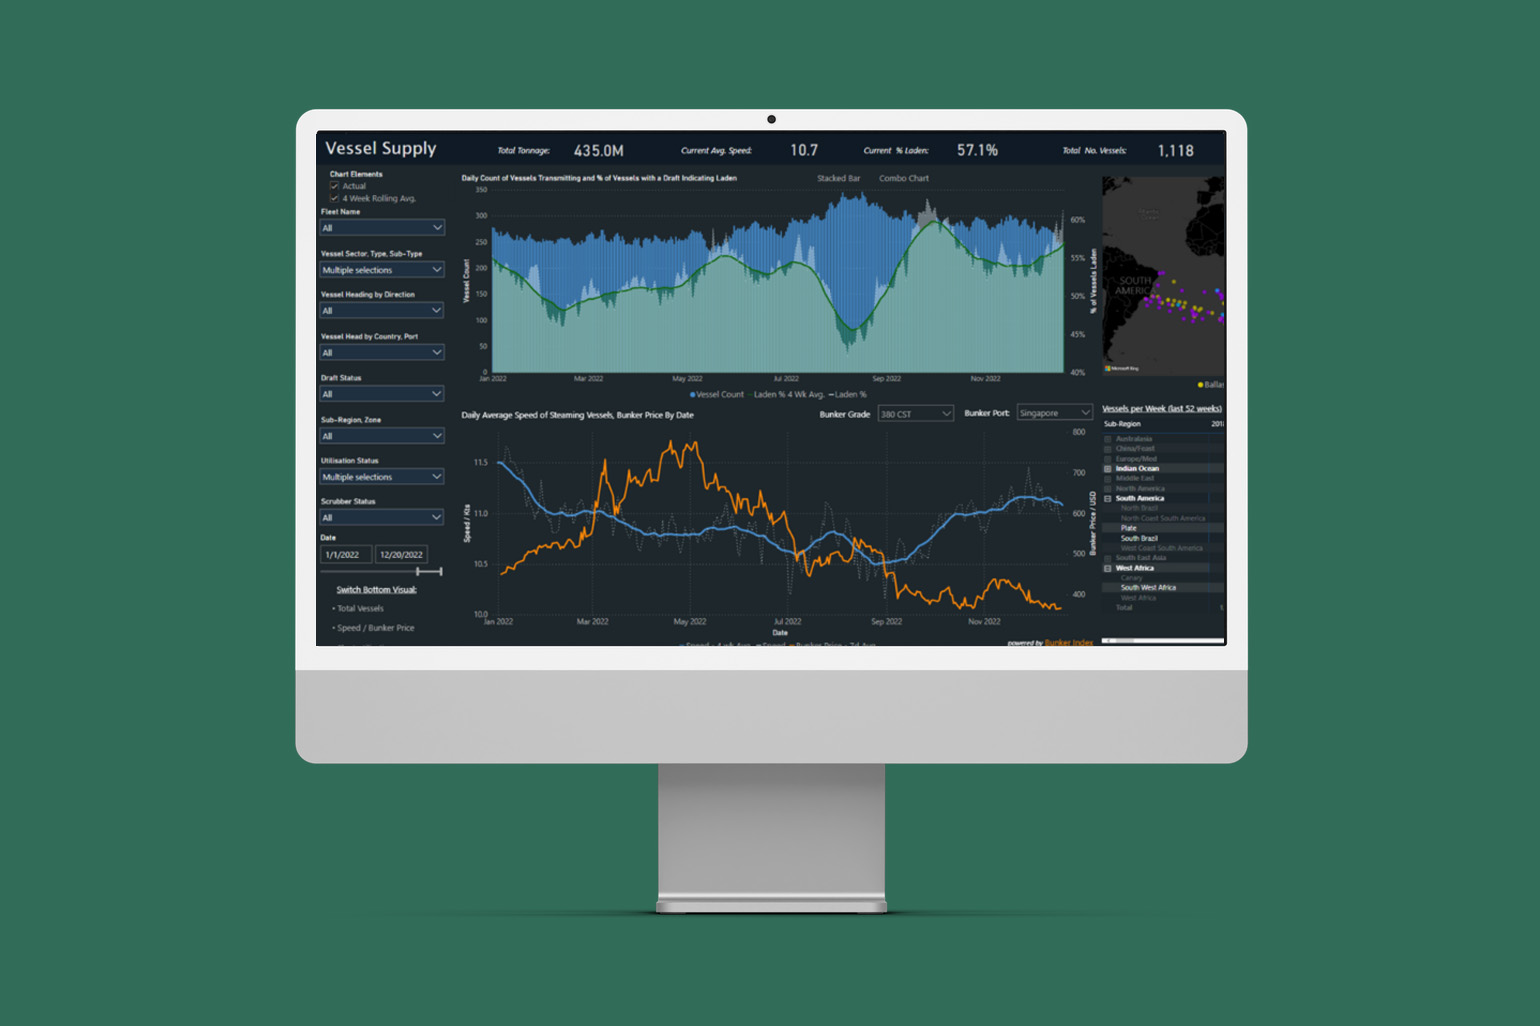
With Ukrainian ports unable to operate we have seen Romanian ports, principally Constantza, become more active to help alleviate this. This was due to the Ukrainian harvest being moved over the border to the Romanian Danube ports for export. This increase in activity can be seen here with the Vessel Supply for Romanian ports shooting up following the invasion:


Capesize Pricing
The end of March and beginning of April saw Capesize prices begin to rise rapidly. This looks to have been triggered by the high utilisation of the fleet. This pressure is exemplified by the C3 route on which over 50% of the fleet was laden, this high pressure continued into June before dropping off in July.
Additional vessels moving into the C3 route then triggered the bubble to burst as more vessels operating meant that there was greater capacity available on the route. This pattern has been mirrored between the prices and the percentage of the fleet that is laden at any time.


The introduction of Dr. Copper
The Sea Pre-Trade Intelligence and Analytics team launched the Copper Ore trade flow dashboard in May 2022. Copper Ore is mined primarily in large open pits in Chile and Peru and transported by Handysize/Handymax ships to smelters in China. Copper is an essential commodity in day-to-day living, from building tools to biology, though most of it is used to manufacture electrical equipment such as wiring and motors. Thus, commodity analysts often cite it as Dr. Copper as it is used to assess the overall economic health.
Although seaborne exports of Copper Ore in 2022 are higher by 6% YTD y-o-y, exports from Chile (which accounts for close to 40% of the global seaborne copper exports) are lower by 2.5% YTD y-o-y. Chile’s loss was Peru’s gain, as the country has managed to capitalize on the opportunity caused by the supply gap and has exported 10% more in 2022 YTD y-o-y. Other countries that increased their exports in 2022 include – South Africa (40% higher), Australia ( 27% higher), and Indonesia (20% higher).0% higher).


The increased demand for King Coal
In July, the Sea Pre-Trade Intelligence and Analytics team reported that global seaborne volumes for King Coal had totaled 358Mt for Q2’2022 – the highest ever since 2019. Increased demand from Indian power utilities and rejuvenated interest from Europe’s biggest Russian gas buyers were the primary reasons for this uptrend. The North-West European port hub – ARA, was experiencing an increase in congestion of dry bulk vessels with a growing number of coal-laden ships from South Africa’s Richards Bay Coal Terminal. Moreover, India imported 29Mt of coal in June (the last round of stocking up before the monsoons), of which 60% originated from Indonesia.
Notwithstanding weaker demand from Chinese buyers due to slow economic growth and Covid lockdowns (almost 10% lower in 2022), India’s imports of coal remained strong from a year ago ( 14% higher) due to restocking by power companies and gas to coal switching due to the Russia-Ukraine War increased demand for thermal coal from Colombia, South Africa and Australia. As a result, the fall in receipts of seaborne coal by China was offset by the factors mentioned above.
Lastly, despite the ban of the EU on Russian coal, the Russian coal export market was well supported by the likes of China, India, Turkey, and South Korea.


EU MRV Thetis Data is released
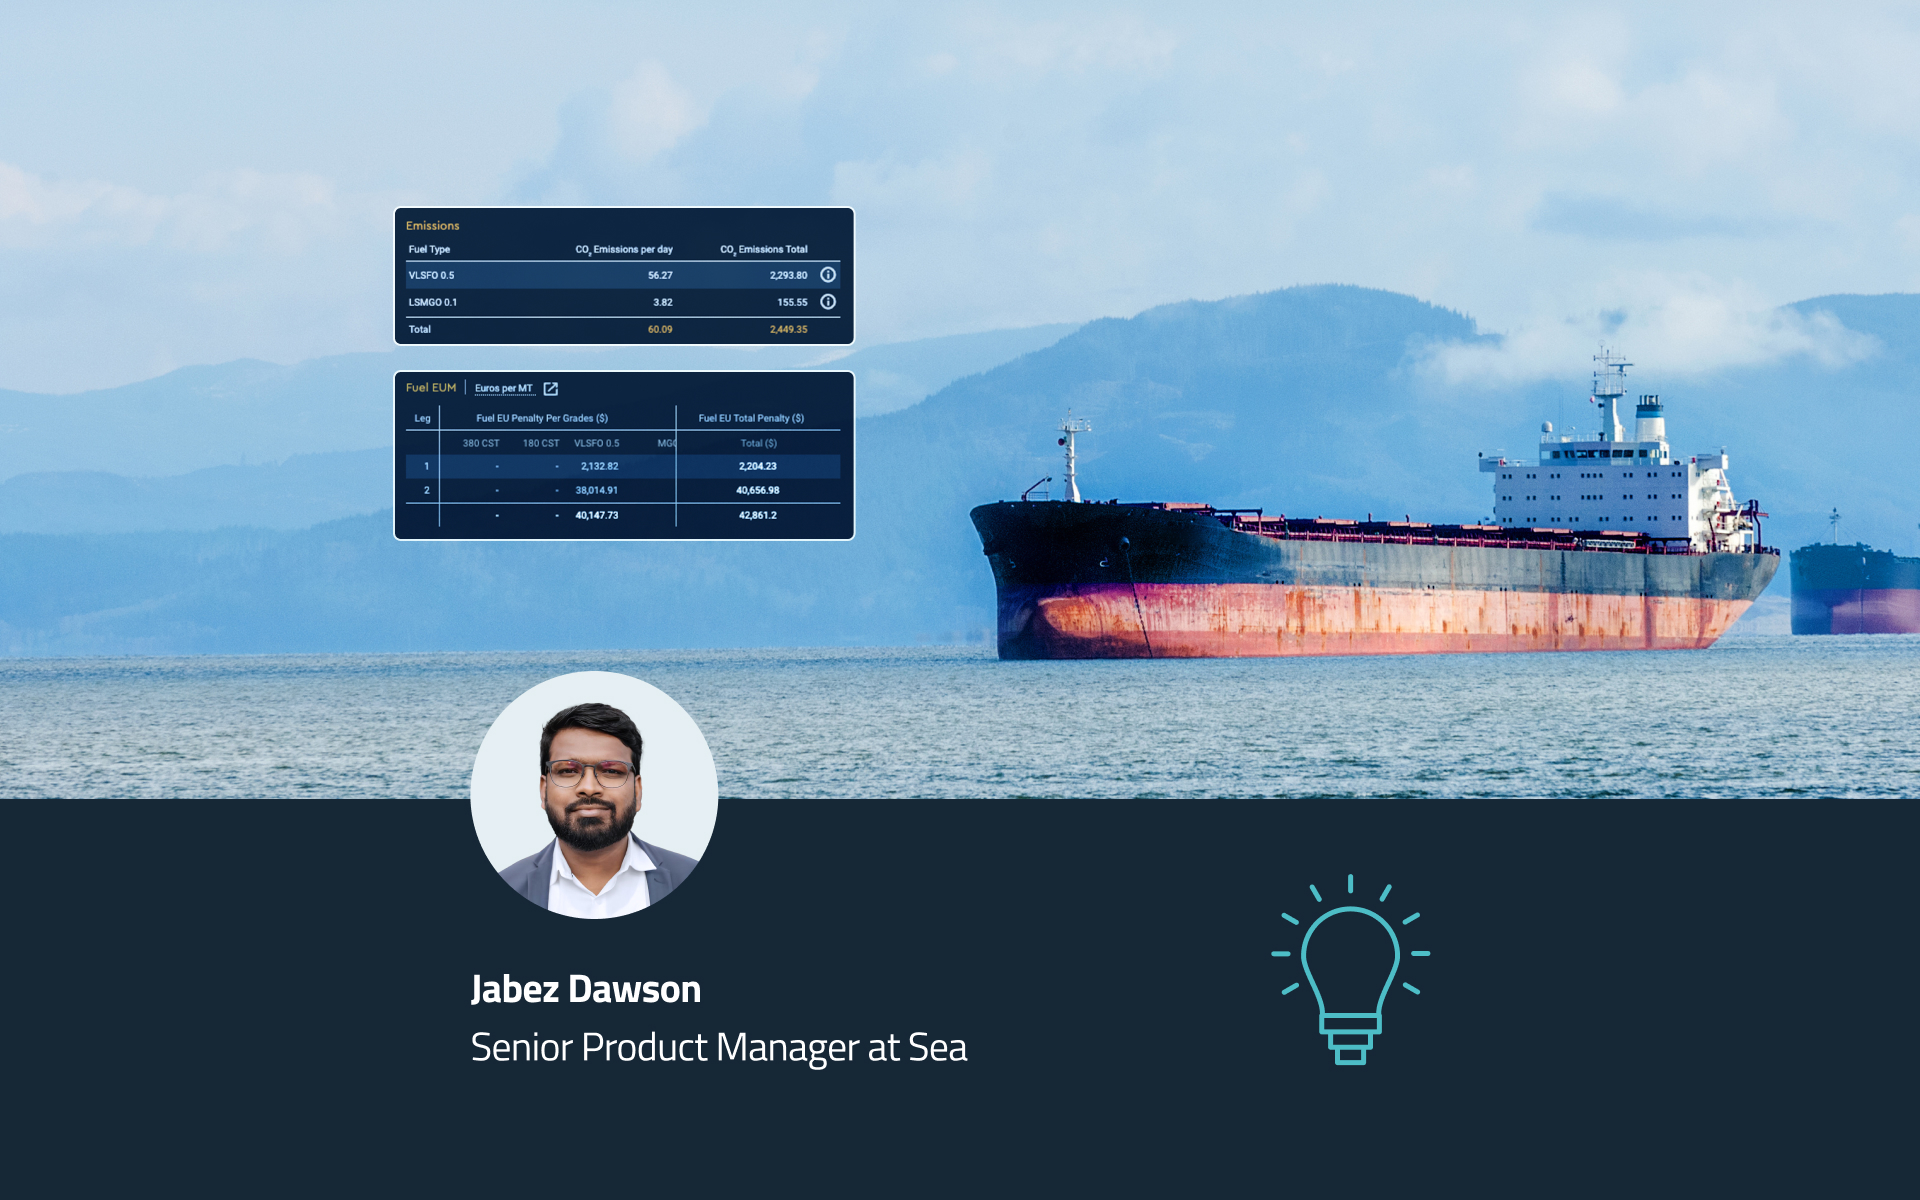
2021 data is released publicly for those to scrutinize over. As vessel operators become more used to reporting consumption and emission information, the shipping industry braces itself for a new year of regulations. The EU were in discussions throughout this year around the implementation of the carbon tax which, previously, was set to begin in 2023. As the end of the year approached, it was then agreed to push back to 2024 in a phased approach. The data submitted to the EU MRV Thetis system is used to help administer this ETS. Sea/analytics incorporates multiple different sources of emissions data, of which the EU MRV is one of the more encompassing sources.
The image above shows a lens of bulkers and tankers. We see an increase of A-rated vessels to 40% from 35% the previous year in 2020 with a large portion of those attributed to the bulk sector. Last year, 2021, however, we saw a small decrease to 37%. A strong year of rates across most dry bulk sectors and as you would expect, a higher average speed of the fleet may have been contributors here. Below we see the average speed across the fleet was up to 11.81 kts in EU waters similar timings to when rates peaked – this has the potential for vessels to forgo some of the efficiencies of slow steaming to capitalize on higher rates at the time. While a decrease in A-banded vessels isn’t necessarily a cause for worry, it does indicate how higher rates could well be pinned as a disrupter in the strive of reducing emissions.
Sea offers a Carbon Accounting and Monitoring module that effortlessly captures maritime seaborne emissions and focuses on both the CII and the EEOI: a more representative measure of cargo transport efficiency.


Black Sea Grain Initiative
In August a long-awaited agreement came into force which allowed shipping out of Ukrainian ports to resume albeit in a more restricted manner. This has been hugely important to global grain flows as in recent years Ukraine has been accounting for roughly 10% of global seaborne grain exports. Although trade has resumed there is a significant backlog of grain to export and year on year the volumes moved are still down approximately 60% compared to the previous year.
Congestion at Istanbul rocketed largely due to the inspection point slowing ships passage through the straights. Raising the average days in port from <0.03 of previous years to almost 3 days


Russian Coal Ban
One of the new policies driven by the Russian-Ukrainian conflict has been the EU ban on Russian Coal.
This has not greatly reduced net Russian coal however there has been a stark shift in where this coal is being exported to. Germany is a key example where imports of Russian coal have ceased completely since the ban has come into effect. China, South Korea, and India have been key importers of the coal to cover this difference.


Zero Covid
China closed some of its largest ports in September due to its Zero Covid policy. This controversial policy caused worries of congestion like the previous years. This, however, has not seemed to be the case as despite a huge decrease in the numbers of vessels on those days this was followed by more activity than normal days to make up for the backlog, meaning the average congestion for the month was in line with what was expected. This can be seen in the example from Shanghai below:

Sourcing gas for Europe
LNG imports have been a hot topic bubbling away on everyone’s agenda as gas prices soar in Europe and some nations search elsewhere for their main source of natural gas. Throughout the year we saw a vast increase in LNG imports via waterborne trades, a 66% uplift from last year’s US to Europe, and 4 countries (UK, France, Netherlands & Spain) saw an increase to over 100 voyages throughout the year so far. Collectively these 4 nations YTD had an increase from 229 voyages to 526.
In any situation, an increase like this strains the infrastructure required to handle such volumes and bottlenecks begin to form. Spain alone has so far received 145 LNG vessels from the US and in October problems switched from sourcing alternative natural gas to their domestic capability to shift it from port infrastructure.
In October, See Pre-Trade Intelligence and Analytics picked up 11 laden vessels sitting stationary off the Spanish coast as vessels sat adrift, waiting for port facilities to accept their cargoes. This situation carried on for the majority of October before easing in the last week before November.


All good things come to an end – container rates drop
It was hard to miss the spectacular bull run on container rates over the last few years with a stunning first half of 2022. The second half, however, saw congestion easing with average time spent in port for containers reaching the lowest levels since 2020, which, combined with lower sentiment, led to a drop off of spot box freight and containership charter rates.
Sea Pre-Trade Intelligence and Analytics also observed a decrease in steaming speed from 14 – 13.6 bottoming out in November before recovering slightly. There will be a continued focus on container speeds as we head into next year with operators citing it as a way to curb emissions ahead of regulatory changes


The December oil ban
There has been a climbing number of tankers in the Black Sea and Turkish Straits as the oil ban bites.
Tanker callings in Western European countries where vessels originated from Russia have had a dramatic decrease this year. With the oil ban coming in on December 5th we should expect to see a continuation of this trend well into 2023. The dashboard below depicts the previous year in blue with the current year’s port callings in white.
Sea Pre-Trade Intelligence and Analytics lets us flip this one on its head. While although we see a decrease this year in Europe, where is Russian crude being sent? With Ural crude falling below $55/barrel, Russian crude will be snapped up by countries not supporting the ban at a discounted price. So far this year we’ve seen increases in China and large increases in India. Time will tell whether this trend continues.
We look forward to another year of greater insights and market reporting with the analytics team. To find out more about Sea Pre-Trade Intelligence and Analytics or to receive a free demo complete the form below.


Share this article
Don’t miss the latest news and insights - subscribe to our newsletter
For press enquiries, please email news@sea.live